
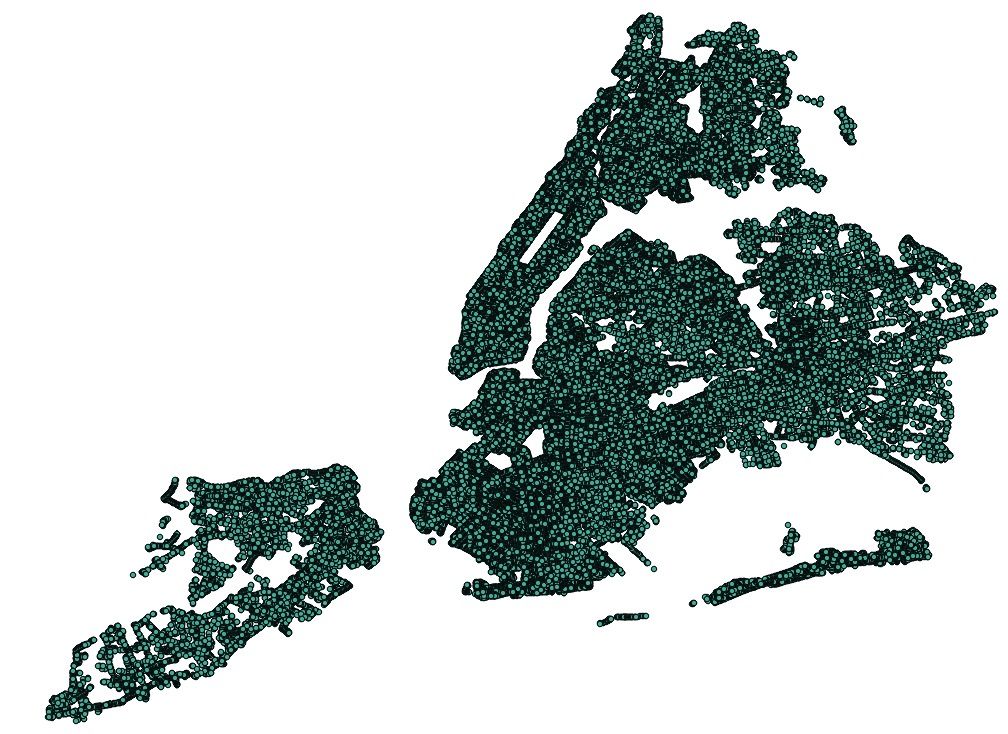
Maps all parking signs in NYC.
This post might be too easy for any Data-viz people but as a beginner tapping in this area. It took me quite a long time to figure it out so I just want to share this hoping that it might save people’s time.
Parking in NYC is really a pain, especially street parking where there’re lots of signs and regulations. There are some apps on Android and iPhone that you can download and see signs but I haven’t been able to find the one that suits my needs. I want an application that can tell me where to circle arounds on which day and time to find parking spot. For example, I parked my car on a Tuesday which has street cleaning on Wednesday and Friday from 8:30 to 9:30. That means I have to move the car on Wednesday morning to find a spot for Friday. The problem is I don’t know what’s around me. The closest application I find is http://www.nycparklife.com/streetparker/ which it doesn’t have Manhattan.
Getting the data
So, I googled and thank NYC.gov that provides the data for us. First, I played around with the csv files but they don’t have coordinates that I can place location on the map. And I have no experience dealing with shapefiles.
Extracting the data
After a few hours of mangling and munching the csv with Pandas and R. I would not be able to get the exact locations of all the signs. So I turned to shapefile hoping that I might get lucky. And I found this http://www.shpescape.com/ which promised to transform shapefile to Google Fusion Table. Awesome! I went ahead and tried it. It works great! but it only gives you the first 100,000 rows. So dug deeper. After another few hours of googling I found qGis which is a opensource project that you can use to open and view shapefile.
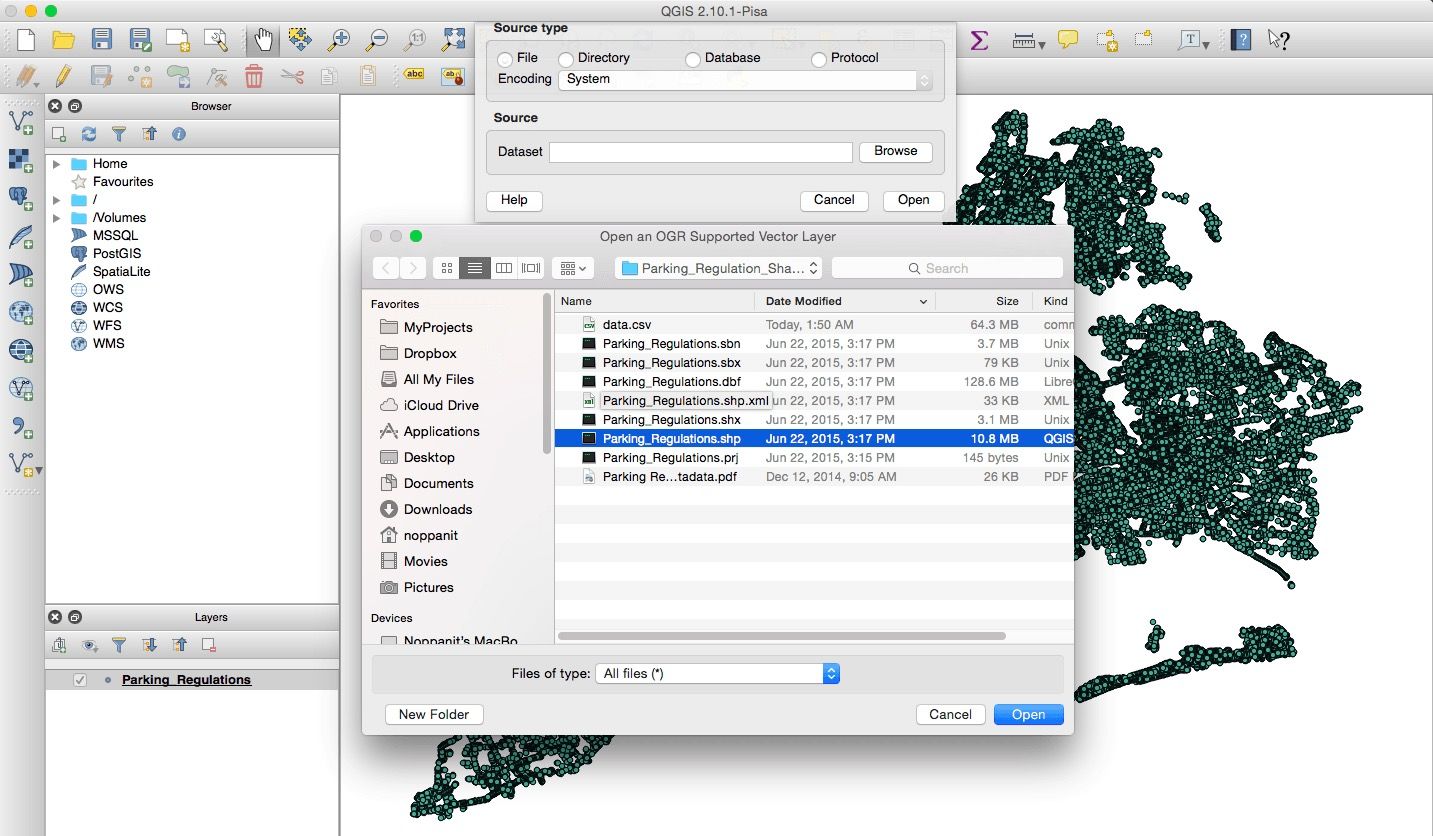
Here’s the example.
One thing I learnt was that you cannot just click Open and choose the file. What you need to do is to
Export to Google Fusion
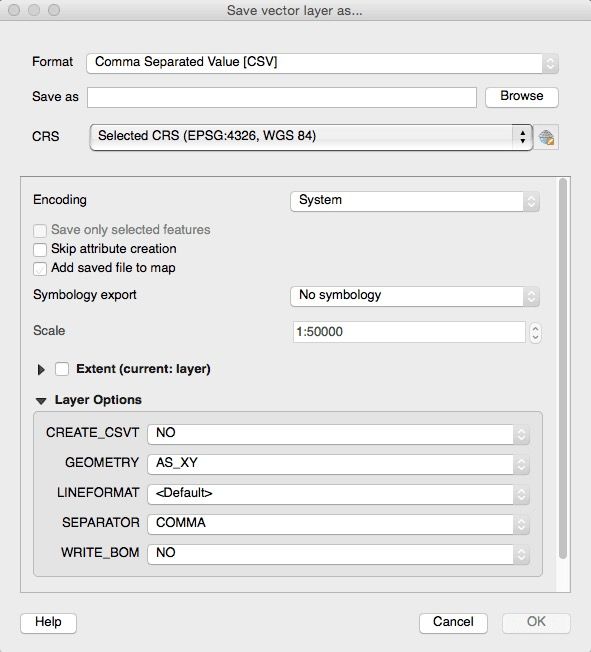
Now what we need is to import what we have to Google Fusion Table. How are we going to turn this beautiful layer to Google Maps. We need CSV…
In QGis you can download the file as CSV. It’s in Layer > Save As. You just need to make sure that Geometry has to be set so you get the coordinates.
Import to Google Fusion Table
Now we can use that CSV to import to Google Fusion. It would look something like this.
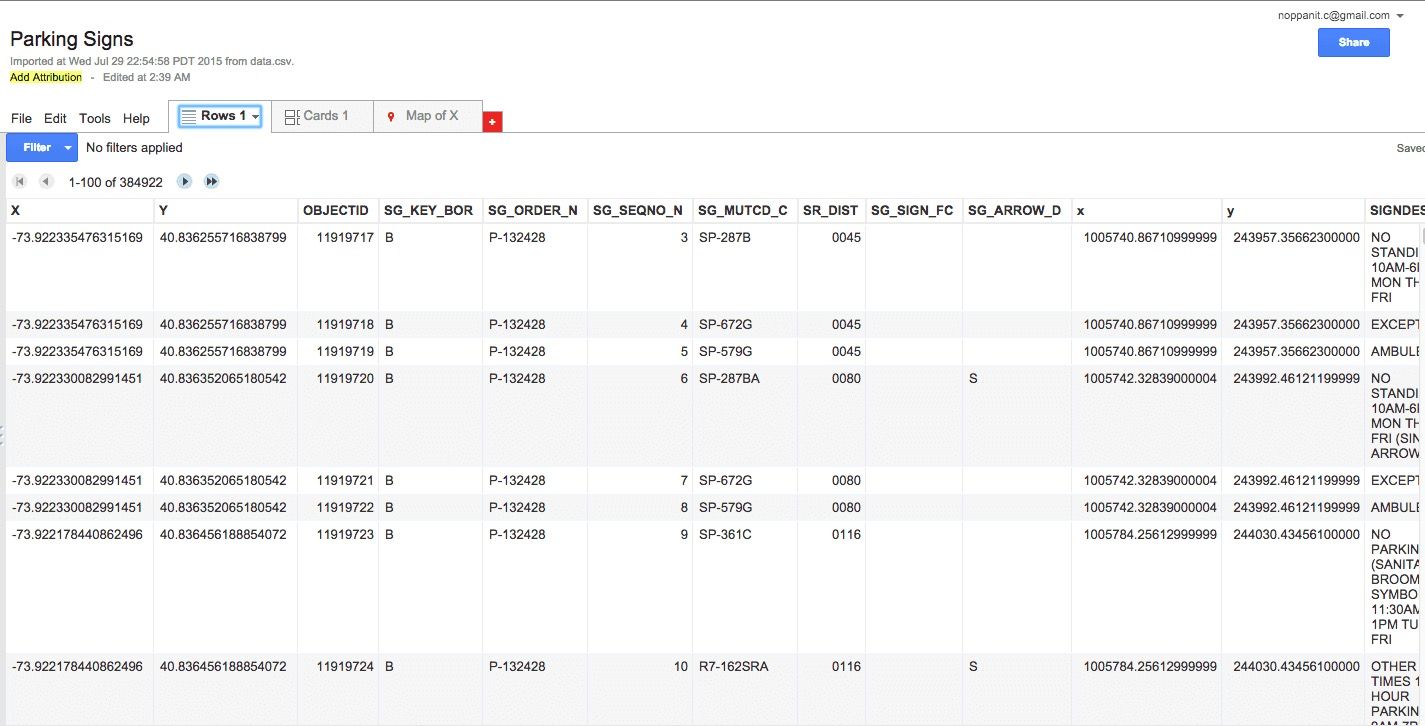
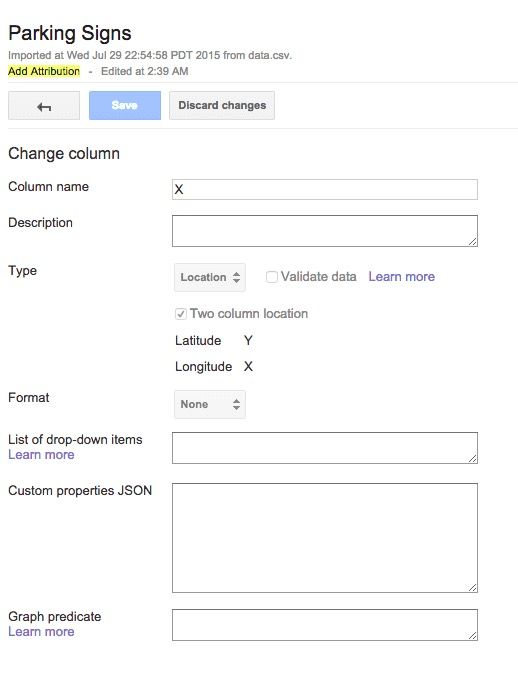
what you need to make sure is that you need to specify which fields are Lat, Long so Google can plot that for you.
Here’s how you do it.
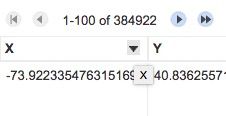
The click change You will see something like this and you can choose which field you want to be Longitude or Latitude.
Once the coordinates have set we can go to Map tab and see beautiful little dots that show where all the signs are in NYC.
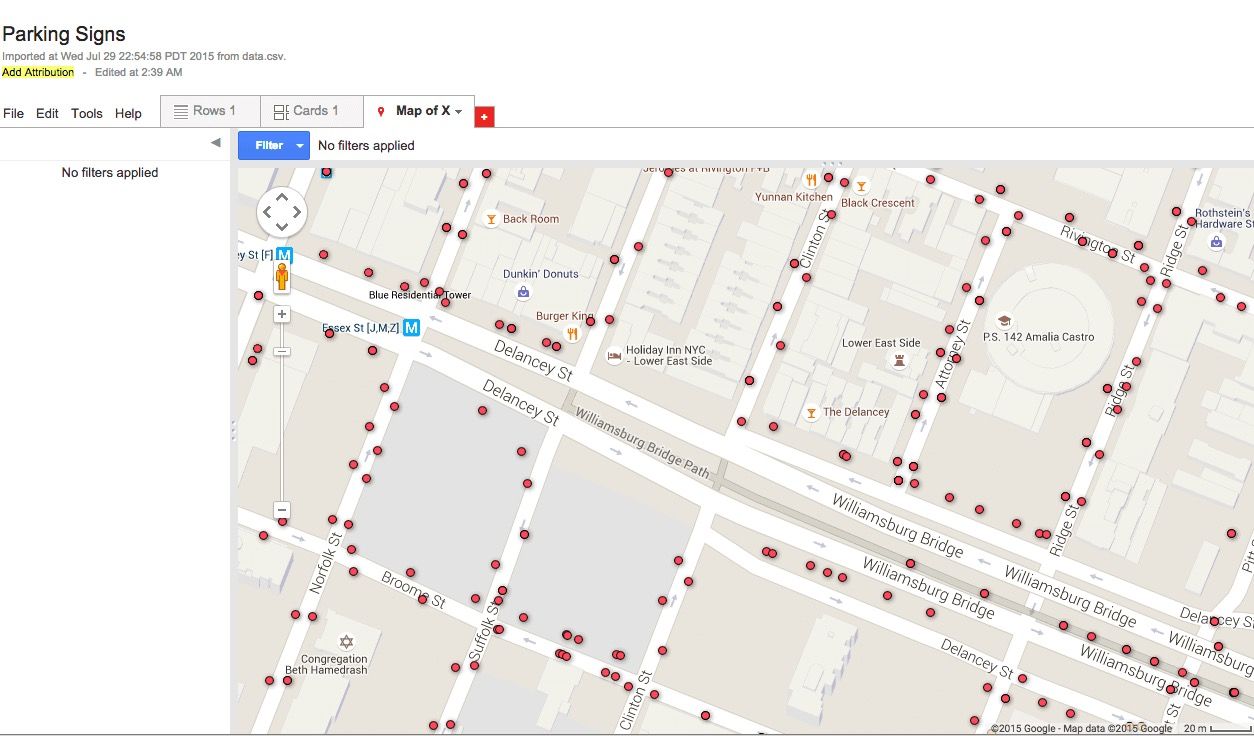
Walla! Now you have something you can build an application on top of it. The next post, I will create an application on top of this map to make use of our data.
Things I have tried and failed
I’ve tried using Proj4 on both R and Python to convert X,Y WGS84 to Lat, Long. Here’s my little snippet.
data = read.csv('./parking_regulation.csv')

library(proj4)
proj4string <- "+proj=lcc +lat_1=40.66666666666666 +lat_2=41.03333333333333 +lat_0=40.16666666666666 +lon_0=-74 +x_0=300000 +y_0=0 +ellps=GRS80 +datum=NAD83 +to_meter=0.3048006096012192 +no_defs"
latlong_list<-list()
calculate_long_lat <- function(x,y) {

  # Source data
  xy <- data.frame(x=x, y=y)

  # Transformed data
  pj <- project(xy, proj4string, inverse=TRUE)
  latlon <- data.frame(lat=pj$y, lon=pj$x)
  latlong_list[['latlong']] <- latlon
}

apply(data[,c('x','y')], 1, function(y) calculate_long_lat(y['x'], y['y']))
The result is not quite accurate which I think it’s because I need to find a correct proj4string.
Python has the same wrapper which is quite what I want as well.
from pyproj import Proj
import pandas as pd

data = pd.read_csv('parking_regulation.csv')

p = Proj(r'+proj=lcc +lat_1=40.66666666666666 +lat_2=41.03333333333333 +lat_0=40.16666666666666 +lon_0=-74 +x_0=300000 +y_0=0 +ellps=GRS80 +datum=NAD83 +to_meter=0.3048006096012192 +no_defs')

def cal_long_lat(row):
    return p(row['x'], row['y'],inverse=True)

data['lon'], data['lat'] = zip(data.apply (lambda row: cal_long_lat (row),axis=1))
data.head()
I will need to learn more about State Pane and what is the correct format.
This article takes 2 pomodoros to complete.
Til next time,
noppanit
at 00:00
